Which do you think can detect image difference best: you or a computer?

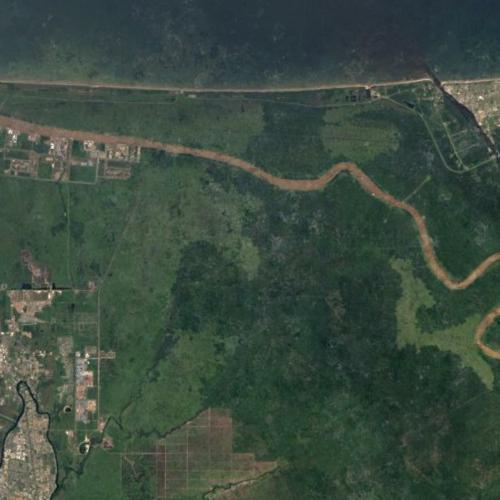
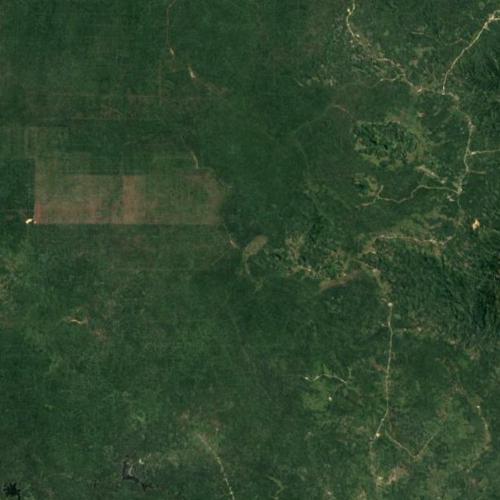
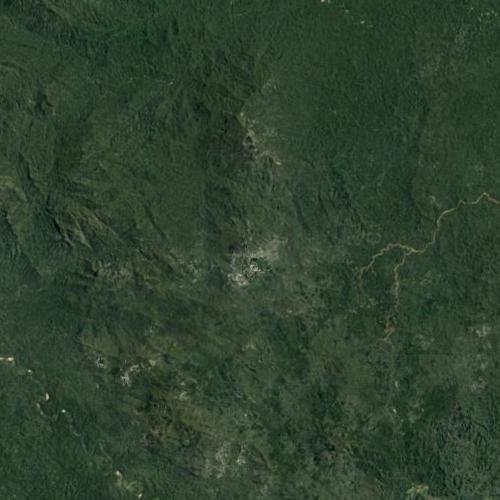
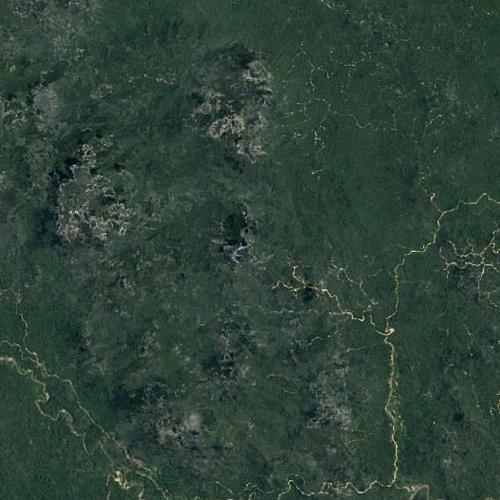
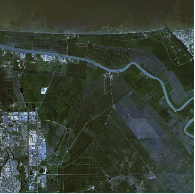
Say you were an environmentalist trying to detect deforestation using historical satellite imagery. Imagine what could happen if computers could detect and predict when, where, and how fast deforestation was happening. This is possible through Machine Learning. Machine Learning is how computers can learn rules and patterns from data to make predictions about new data. 

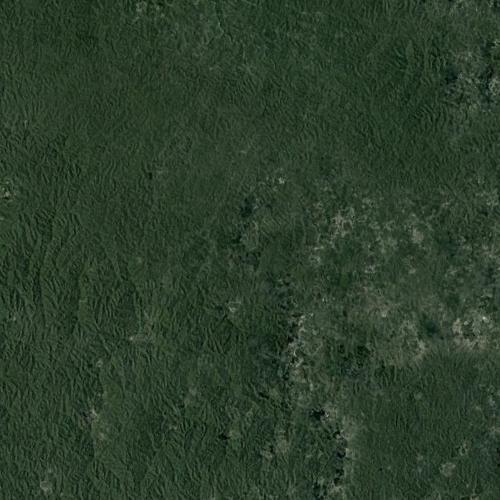
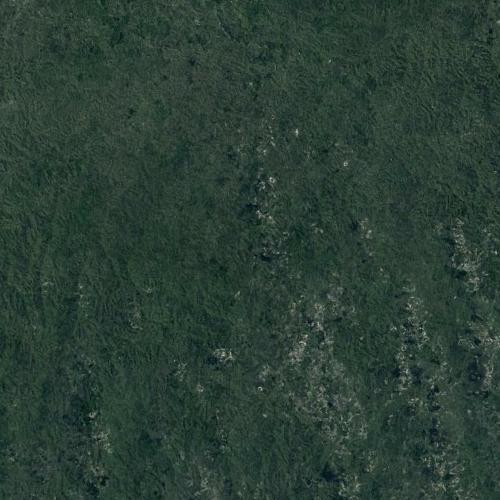
Can a computer use machine learning to be able to tell if deforestation is happening in different areas in Indonesia? Let’s use a tutorial to learn how to use Machine Learning to answer this question.

How does Machine Learning work?

Machine learning uses labeled examples to learn the best rules for separating data into classes (in this case deforestation and non-deforestation). Two major stages in Machine Learning are training and testing. In the training stage, we will train our computer using a subset of our picture dataset that we have already labeled. This will produce a model, which will make predictions on new examples. In the testing stage, we will see how well the model performs when it has to make predictions on unseen data. 

As we work through our deforestation example, we will evaluate whether or not the computer can classify our images as well as we can. This is important because we want to ensure that the computer is making accurate predictions compared to ones made by a human.

Let’s learn how to do Machine Learning!

Step 1: Labeling Data

First, we need to label our data with categories. Check the boxes on the right where you see evidence of deforestation. Of these labeled images, we will use 15 to train the machine learning model. We will save the remaining 10 images to test the model later.

25 labeled images is a very small sample size for training a model. However, it will work to illustrate the concepts in our tutorial.

Labeling Data

Please label the example data below according to the text we provided that specifies the class values for each pair of images.

Thank you! Your submission has been received!
Oops! Something went wrong while submitting the form
Thank you! Your submission has been received!
Oops! Something went wrong while submitting the form
Thank you! Your submission has been received!
Oops! Something went wrong while submitting the form
Thank you! Your submission has been received!
Oops! Something went wrong while submitting the form
submit

Step 2: Calculate Differences Between Before and After Image Pairs.

Computers view pictures as numbers, which are represented as RGB values. RGB values are numbers for red ( R ), green (G), and blue (B) values that tell a computer which color to display. Therefore, we first need to convert our pictures into RGB values.

The way we can tell if deforestation has occurred is by examining the difference in the “before” 2000 pictures and their corresponding “after” 2015 pictures in the picture pairs. For our tutorial, one way we can do this is by seeing if there are differences in the red, green, or blue coloration (RGB values).

To do this, select which image pair you want to work with on the right hand side. We will demonstrate below using an example.

Image Difference

Please select a pair of images to look the difference.

Before

Red Mean: 50
Green Mean: 100
Blue Mean: 20

After

Red Mean: 20
Green Mean: 10
Blue Mean: 0

Red Mean: 20
Green Mean: 10
Blue Mean: 0

Step 3: Select Useful features

A feature is a Machine Learning word for characteristic. Computers categorize data into different classes by reading data’s different features. Let’s pick two out of our three R, G, and B difference options. For each matching pair, we will subtract the 2015 image from our 2000 image. By looking at the difference, we are observing change over time.

Take a look at the plot that resulted from your features. All the red dots belong to the deforestation class. All the blue dots belong to non-deforestation.

The best case scenario as we look at the plot would be if there was perfect separation between the blue dots and the red dots. This would mean that the features we selected did a perfect job at separating our two different classes. What do you think of the plot? If you are unhappy with the separation, then you can go back to the feature tabs and try selecting other features until you are satisfied.

Feature Selection

Feature 1
Feature 2
View as


Step 4: Train Your Model

A model is a set of rules to help separate the two classes we are interested in, and it takes into account the features we selected. It is used for predicting the class of a new, unseen example. The model is represented by a decision boundary, which in our plot, is the line that separates the deforestation and non-deforestation classes. After you are happy with the features you selected, we can move on to train the model on the training data. Try training a model yourself on the right by clicking the Train button.

Train Your Model


Step 5: Test Your Model

In order to see how well the model we just trained performs, we will test it on the testing data. Try testing yourself on the right by clicking the Test button.

Test Your Model